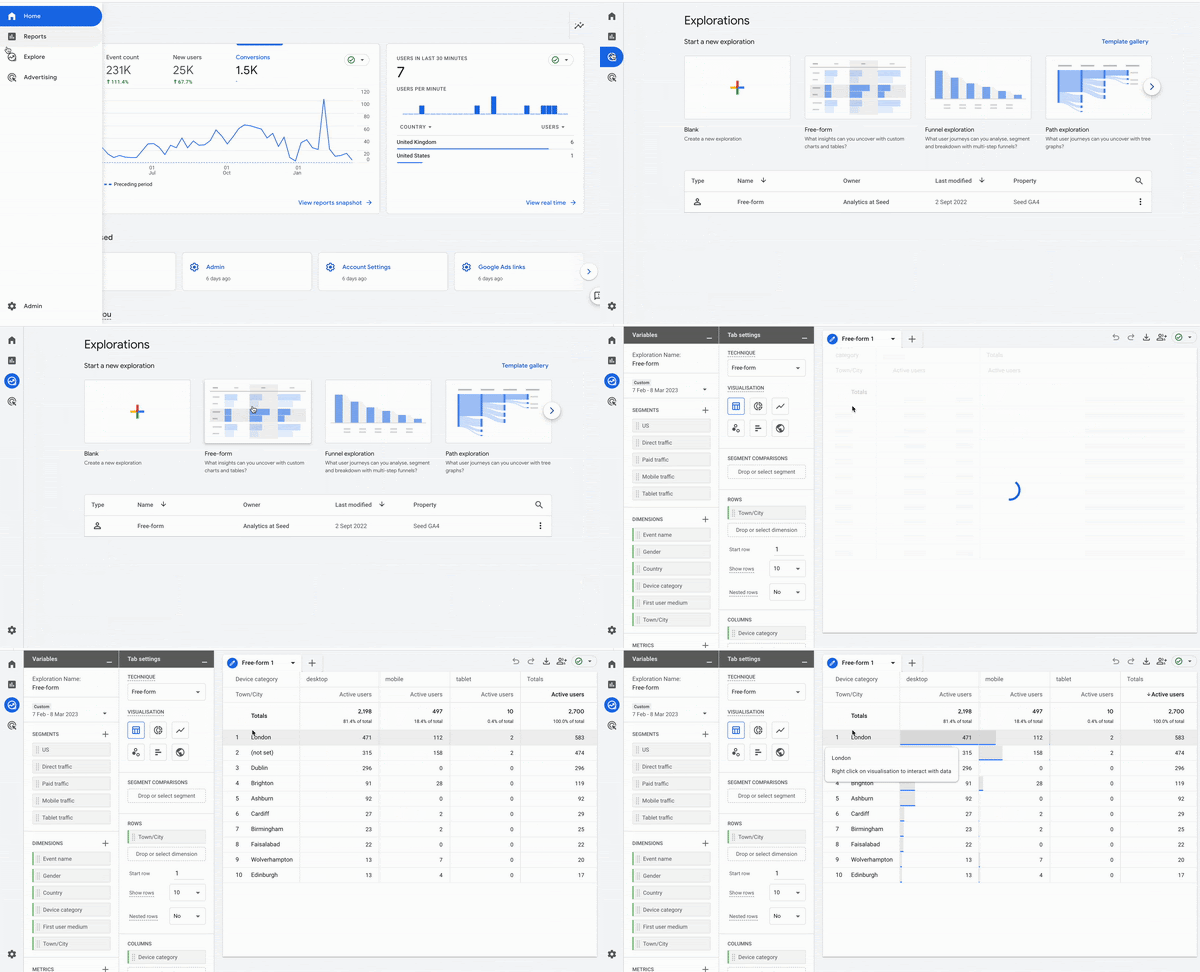
“Explorations” allow users to generate personalised reports. By leveraging Explorations, users can conduct an in-depth analysis of customer behaviour and extract significant insights beyond what the standard Google Analytics 4 reports provide.
Explorations can be saved and shared with relevant people, making it an essential tool for creating bespoke reports that meet specific reporting requirements.
What are the different types of explorations in Google Analytics 4?
Free-form exploration Report
You can organise your data in a traditional crosstab layout, similar to a spreadsheet, and is a common way of presenting data in a table format. You can also use various free-form visualisation styles like bar charts, pie charts, line charts, scatter plots, and geo maps. These allow you to customise the visual representation of your data according to your preferences and help you gain valuable insights from your data.
Cohort exploration Report
You can get valuable insights from the behaviour and performance of user groups that share common attributes, allowing you to analyse how different segments of your audience interact with your website or app.
Funnel exploration
Visualise the steps users take to complete tasks on your site or app, and see how you can optimise the user’s experience and identify over or underperforming audiences.
Segment overlap
Explore the relationships between different user segments. Use this technique to identify new segments of users who meet a more complex set of criteria.
User exploration
Examine the users that make up the segments you have created or imported. You can also drill down into individual user activities on your website or app.
Path exploration
Visualise the paths users take as they interact with your website and app, allowing you to see how different segments move down your conversion funnel.
User lifetime
Explore user behaviour and value over their lifetime as a customer. This can be especially useful if you are tracking micro conversions as you can assign a value to them and use them to provide Google Ads with more data.
What are free-form explorations in Google Analytics 4?
Free-form exploration is a feature in Google Analytics 4 that allows users to analyse data in a more flexible and customisable way. With free-form exploration, users can perform ad hoc analysis by selecting any combination of dimensions and metrics, applying filters, and creating segments on the fly.
The above contrasts with pre-built reports, which are pre-configured templates that provide specific insights; free-form exploration enables users to create their own reports and visualise data according to their unique needs. Doing so can be particularly useful when analysing data unavailable in pre-built reports or when looking for insights that are not immediately obvious.
Free-form exploration in GA 4 includes a drag-and-drop interface that enables users to easily add or remove dimensions and metrics, customise charts and tables, and apply various types of filters and segments. Users can save their custom reports for future use or share them with others.
What are the benefits of using free-form explorations?
The benefits of using free-form explorations in Google Analytics 4 include:
- Flexibility: Free-form explorations allow users to create custom reports that meet their specific needs.
- Ad hoc analysis: With free-form explorations, users can perform ad hoc analysis on their data, which means they can explore and analyse their data in real-time without relying on pre-built reports.
- Discover hidden insights: By creating custom reports, users can uncover hidden insights that may not be visible in pre-built reports. Users can use filters, segments, and other tools to identify trends and patterns that might otherwise go unnoticed.
- Save time: Free-form explorations can save users time by allowing them to quickly create custom reports without spending time building complex queries or manipulating data.
- Collaborate and share: Users can save their custom reports and share them with other users, making it easy to collaborate and share insights across teams.
Overall, free-form explorations provide users greater flexibility, customisation, and insights into their data, enabling them to make more informed decisions and improve their business outcomes.
How can I find free-form explorations, and what features are available?
To access the free-form exploration feature in Google Analytics 4, you can follow these steps:
- Log in to your Google Analytics 4 account.
- Navigate to the Analysis section by clicking the Analysis tab on the left-hand navigation menu.
- Click on the Exploration option in the top left corner of the Analysis screen.
- Once you click on Exploration, you will be taken to a screen where you can create custom reports using the free-form exploration feature.

Here are some of the features available in free-form exploration:
- Drag and drop interface: Users can drag and drop dimensions and metrics onto the report canvas to build custom reports.
- Filters: Users can apply filters to their data to analyse specific audience subsets or website traffic.
- Segments: Users can create segments to analyse specific audience subsets or website traffic.
- Metrics and dimensions: Users can choose from a wide range of metrics and dimensions to analyse their data, such as page views, sessions, bounce rates, and more.
- Visualisations: Users can choose from a variety of visualisation options, such as tables, pie charts, bar charts, and line graphs, to display their data.
- Share and collaborate: Users can save and share their custom reports with other users, making it easy to collaborate and share insights across teams.
If you’re yet to set up your GA4 account for your websites, drop us a message, and we can help you out.


